Skills Match: LMI for All in action
The following are some exemplar screenshots taken from the Skills Match website.
Skills gaps
This analysis shows forecasts of learners successfully completing courses in different subject areas, compared with the vacancies linked to those subject areas, for courses and jobs at Level 3 and below.
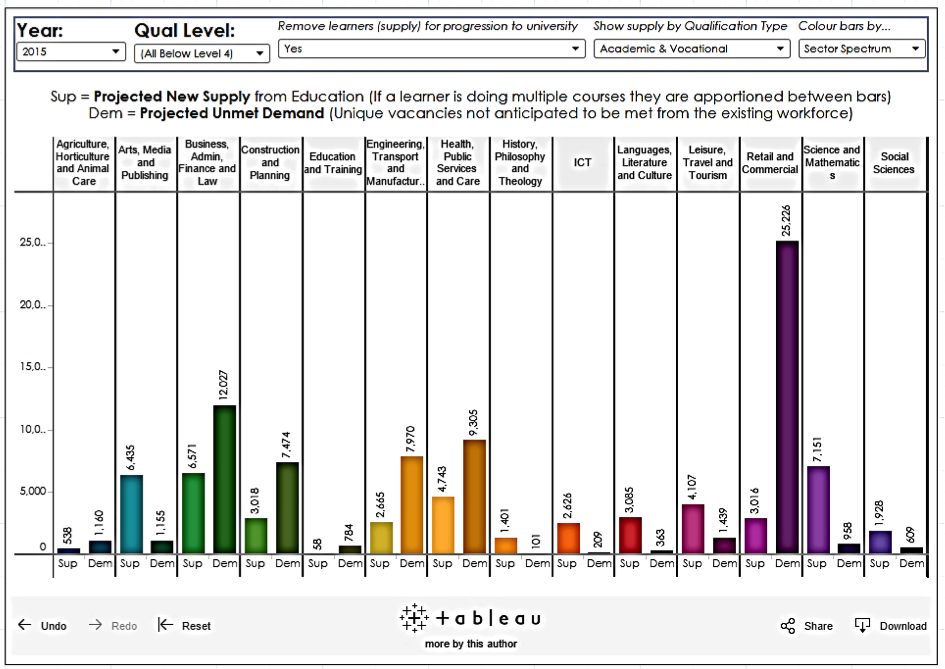
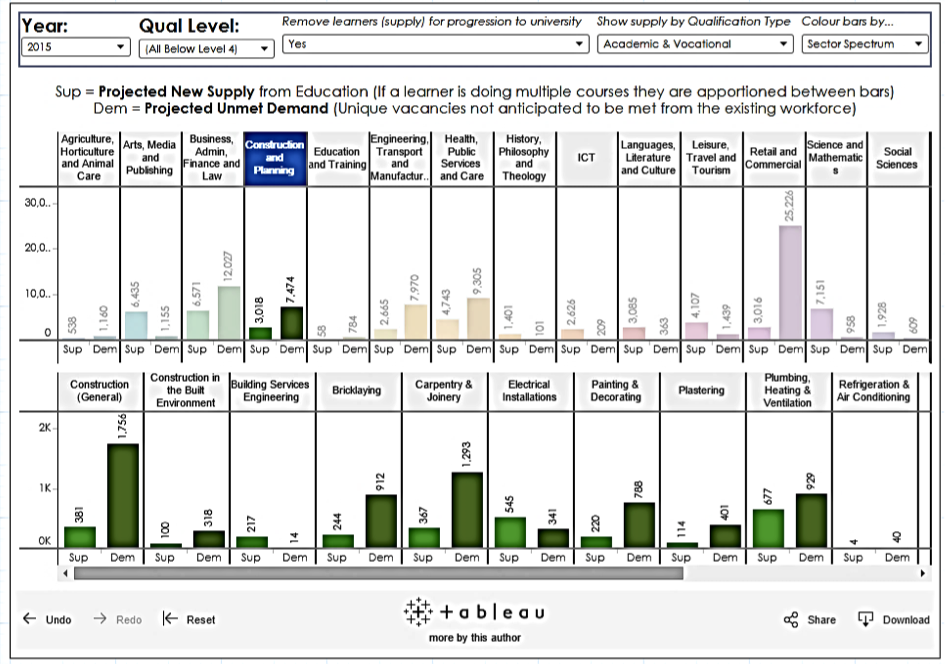
Clicking a bar allows the user to drill-down into the individual subjects within the subject area.
Drop-downs above the chart can be used to:
- Change the year of projections shown (up to 2020)
- Break down the analysis by the level of qualification
- Remove learners progressing to university (this reduces the projected supply from Level 3 courses on the assumption that 66% of academic Level 3 learners and 43% of vocational Level 3 learners go on to Higher Education)
- Show supply by qualification type (choose to exclude vocational or academic qualifications)
- Choose whether to colour the bars by the subject area, supply and demand bars, or to split the supply bar into vocational or academic courses.
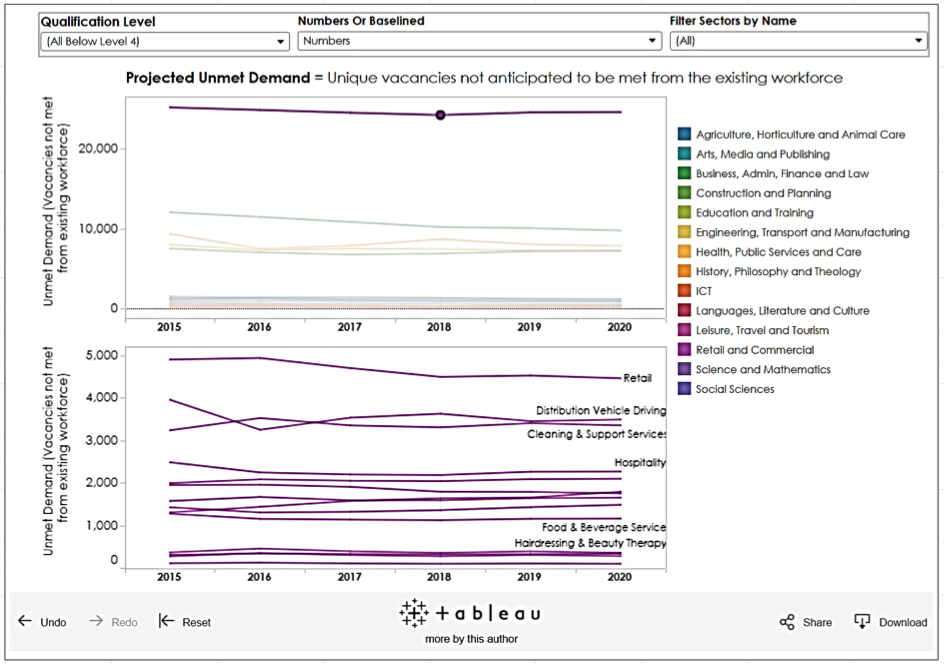
Projected vacancy trends
This analysis shows forecast trends of new vacancies to 2020 linked to their related subject area, for courses and jobs at Level 3 and below.
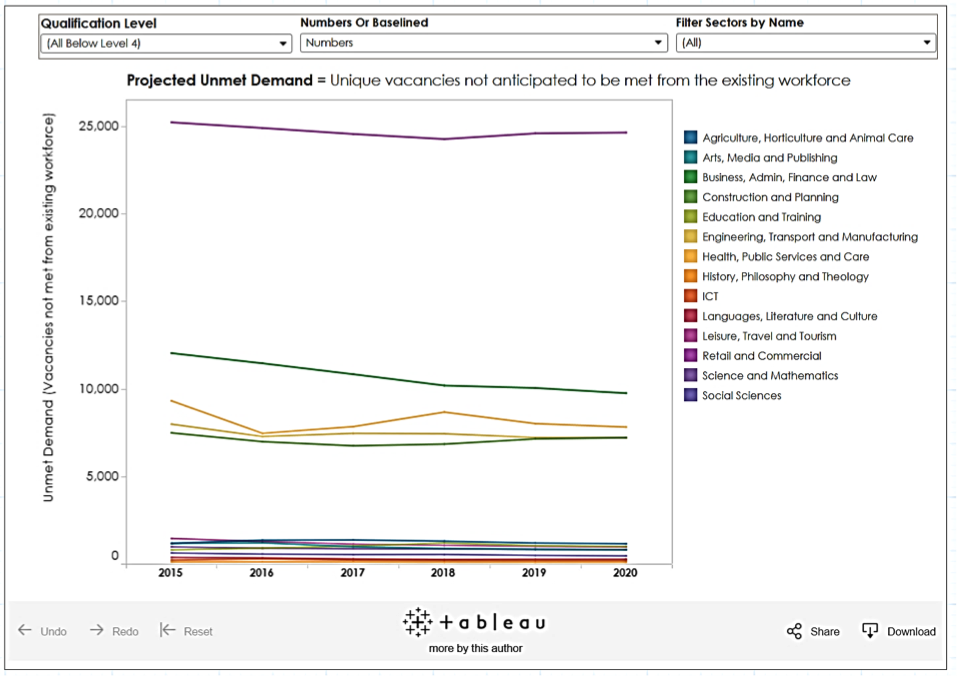
Similar to the skills gap graph, clicking on a trend line drills down into the individual subject.
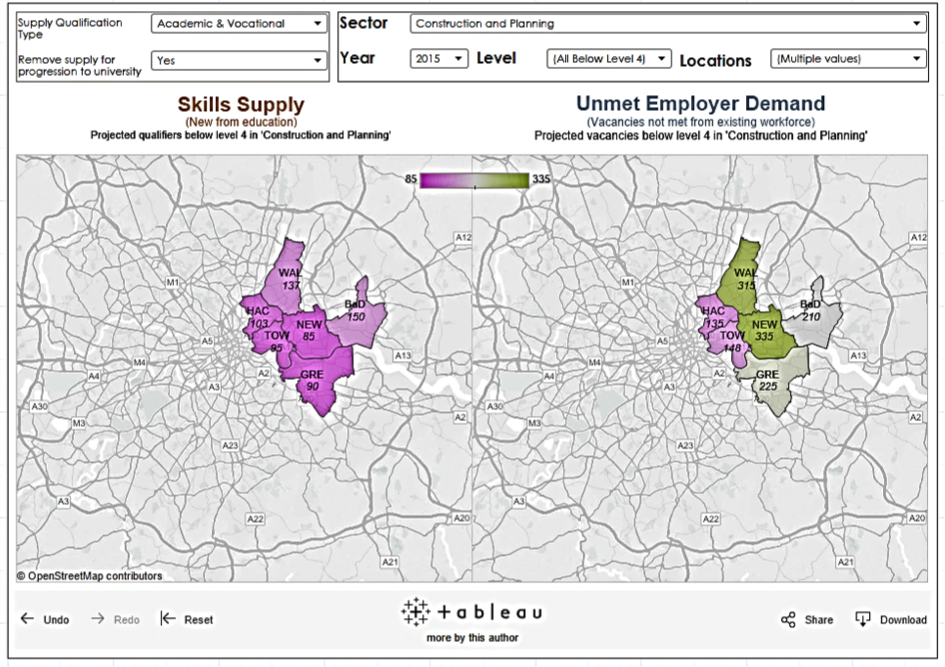
Supply and demand maps
The map below compares future skills supply and projected vacancies in each London local authority, for courses and jobs at Level 3 and below.
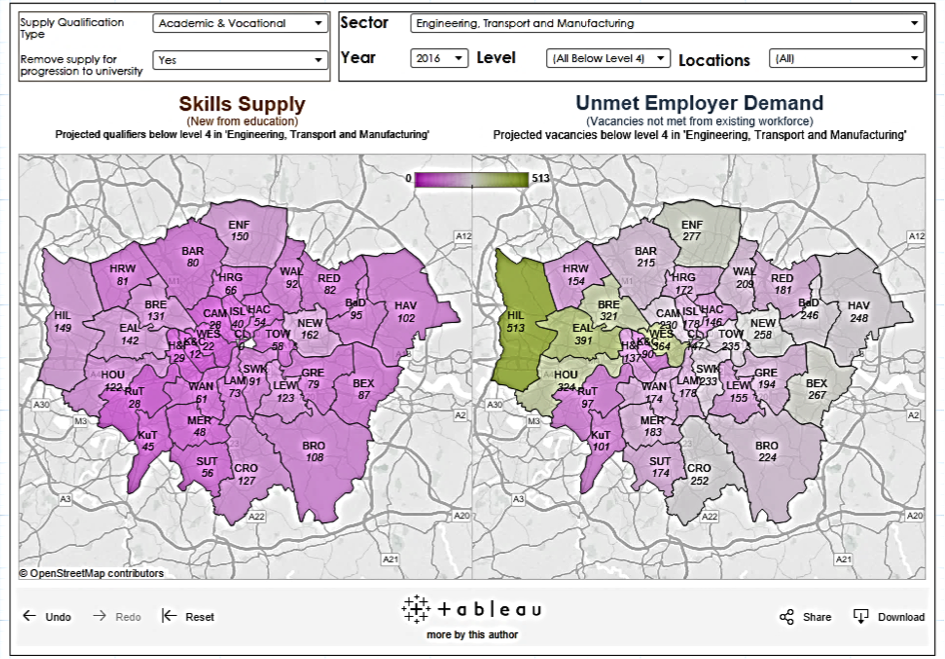
The location can be set to look at individual boroughs or combinations of boroughs, for example, statistical neighbours, travel-to-work neighbours or economic areas.
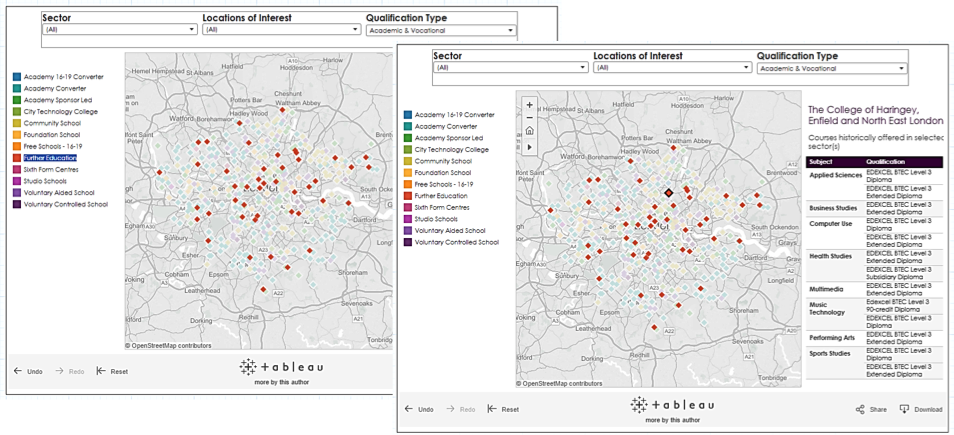
Provision mapping
The provision map in Skills Match shows the providers in selected local authorities that offer subjects meeting the selected requirements using a series of filters. For example, an employer could look for schools or colleges offering Level 3 courses in Construction and Planning; the results would show providers that have historically offered subjects in this field and hence might be able to provide the skills they are looking for.
The map below shows educational establishments in London that have historically offered different subjects at Level 3, split by type of qualification.
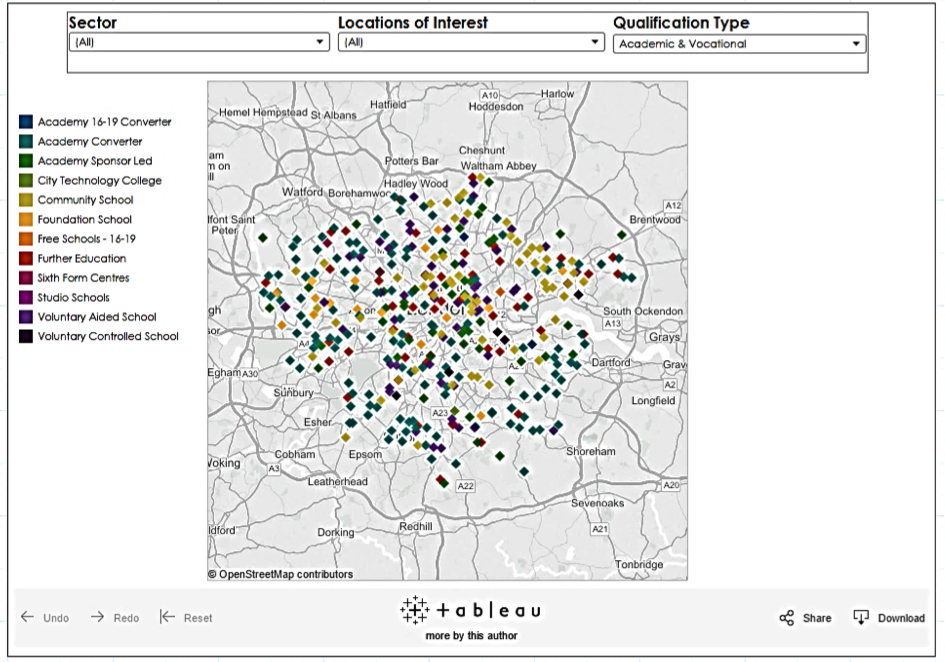
Drop-downs above the map can be used to choose the sector subject area of provision, the type of qualification and the local authority (or authorities). Hovering over a dot brings up the name of the educational establishment.
Clicking on an institution category shows only institutions of that type. Clicking on a dot brings up the subjects historically offered