Building LMI for All into an existing website: icould
‘icould is based on the idea of career exploration, encouraging young people to discover career possibilities, including options they may not have considered or didn’t know about, rather than trying to match them to a particular job type. We recognise the many influences that can affect career choices and see careers very much as a continuous process as opposed to a one-off decision.’
About icould
icould uses real voices to help young people learn more about the world of work. Using video interviews, the free-to-use website offers unique insight into the day to day roles and career pathways of people working in a range of jobs.
icould has over 140,000 unique users per month, with users spending an average of six minutes per visit. It is used by a wide range of education establishments and individuals, mainly in the UK.
In addition, videos are licenced via an API feed to CASCAiD and Discovery Education, both used in schools, as well as other partners including Careers Wales, u-explore, Duke of Edinburgh Award, Skills Development Scotland, UCAS. Video content is also available via its YouTube channel. Via this wider distribution network there are over 500,000 additional opportunities to see the careers videos and link back to the icould website.
icould is a small charity funded by a number of sources, including philanthropy.
What is on the icould website?
icould includes over 1,000 careers video stories that provide a real view of what it is like to work in particular jobs. Articles on a range of topics are available from people sharing their experiences, together with advice from industry experts. For example, information for young people and parents on key educational decision points and career-related topics (such as making job applications, CV writing, interviews and networking). There are also articles on a range of sectors, which describe potential future opportunities.
A popular feature of icould is the Buzz Quiz, which is based on Myers Briggs (a personality test). By answering a series of multiple choice questions, users find out their personality type linked to animal and an idea of the careers they may be best suited to. This is used within schools as part of careers education lessons, as well as people on an individual basis.
How does icould use LMI for All?
icould was an early adopter of LMI for All data, using it underneath the career videos, to visualise useful job information using charts and icons. It is based on the idea that someone could watch the story of someone talking about their job and then scroll down to the labour market information data for more information.
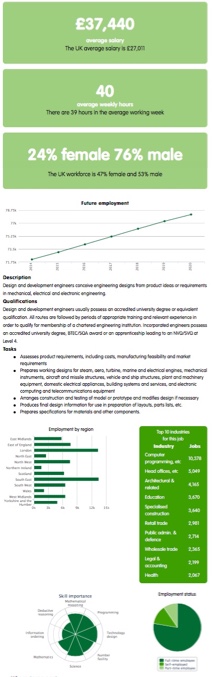
For each video, occupational information is provided, including average salary, average weekly hours, past unemployment, predicted employment, top 10 industries for the job, employment status of workforce, occupational description, qualifications required for job, tasks, employment by region, gender profile of the workforce and the skills important for the job.
The LMI for All data are also being used as part of the regional and national webpages to show the most popular jobs and the jobs with the highest number of vacancies.
Providing labour market information in a user friendly way significantly adds to the careers story featured in each video and is a unique selling point of icould.
Why LMI for All?
‘By combining inspirational, real-life stories from the videos with detailed robust job information, a user could get a lot to go on in terms of informing career choices. LMI for All was a ‘natural fit’ for us having already developed video content – it helped to strengthen our offer and connected well with our intention to present a balanced view of careers.’
The LMI for All data are considered a high quality source, as it comes from official national and regional statistics. Using these data addressed feedback from users that icould could be improved by including hard evidence to support career choices.
‘Regional, occupational and vacancy data were particularly in high demand. LMI for All was considered the only good source of reliable LMI that integrated a number of sources into the database, which would address our needs.‘
LMI for All, as a freely accessible source, has enabled icould to make these data available at minimal cost covered by the existing staff budget.
How was the LMI for All data used to develop the web interface?
The main aim was to combine real-life stories with detailed job information. The starting point was to look at the different data sets available through LMI for All and select those that would be most useful and relevant. The team thought through common questions young people ask, such as:
How much will I get paid? What qualifications do I need? What exactly does the job involve?
The icould team were also interested in the more strategic information, such as working patterns, employment levels and the Working Futures data. Within 3 months of accessing LMI for All data, the icould web interface went live. A number of data sets in LMI for All were considered for use alongside the video stories on the icould website. These data included:
Employment (historical, projected) Pay Hours Unemployment rates Skills and qualifications Abilities and interests Occupational descriptions
The icould developer began by designing some layout examples in powerpoint, which were the basis of the data visualisation. Feedback was sought and visualisations refined.
The next stage of the icould development was to apply Standard Occupation Classification (SOC) (this is a common way in which to classify occupations) codes to the back catalogue of videos. This was a manual exercise. In cases where there was not an exact match to the SOC code, the best match or multiple SOC codes were selected. All new videos are now given a SOC code when they are uploaded to the website. An online tool was created to make it easier to look up and assign SOC codes to videos.
What is the impact of using LMI for All?
‘The data has prompted questions from young people on the nature of work and a working week. Users appreciate the value of the data both on its own terms and also as a prompt for wider discussion on careers now and in the future.’
By adopting LMI for All and integrating this into their policies and practices, icould have gained an added-value labour market information resource to complement and extend their existing resources. The integration of the LMI for All data into the icould website has enhanced the offer icould can make to those that subscribe to it’s API. icould has continued to attract new partners and subscribers since its launch.
What advice would you offer?
Some issues encountered along the way were around occupational coding and styling to ensure data was understandable to the audience as well as being visually attractive.
Occupational coding
In order to map the LMI for All data, organised by SOC code, each of the video stories had to be manually assigned an occupational classification code; this took time. The developer created online tools to help this mapping, by displaying potential SOC code titles and descriptions. The developer was able to select the code that matched or edit the search term in order to find a match. One issue was in searching for particular occupations. For example, in order to get returns for lawyer an additional search on ‘law’ or ‘legal’ also needed to be undertaken. icould had technical in-house expertise available to inform and support the occupational coding process.
LMI webpages were created for each SOC linking to the video stories. However, there were concerns as to whether site visitors would understand SOC codes and whether job type may be a better solution. It was decided to continue using the icould classification, as it was tried and tested.
Styling
Styling the data was a big issue and was important to get right, along with meeting accessibility requirements. Colour blocks and more colour were added after the initial visualisation drafts. Table styling was also developed. Work was undertaken on ensuring that the videos and data ‘gelled’. This resulted in the data and charts being moved around to look less dense and putting the more appealing data first. Using rough rankings of skill levels were thought to be bland, so decimals were incorporated instead. Initial visualisations used a spider diagram to display the skills data, but this was changed to the windrose chart as it was thought to be easier to understand.
How has icould developed their use of LMI for All?
It was reported in Making use of icould: learning from practice (2015) (no longer available in 2023) that the usefulness of the LMI facility on the icould website. In 2015, the icould website and LMI visualisations were redesigned to improve the user experience.
To complement the LMI data, icould also introduced a live jobs feed providing information on local jobs and employers and examples of real job specs and requirements.
In 2016, in response to user feedback:
average statistics were introduced into certain fields
the ordering of some of the visualisations and data were changed
some of the graphics were simplified
the colour palette was changed
The aim has been to improve data interpretation by providing context and giving users a benchmark, allowing for easy comparison between the average salary for a particular job type or average weekly hours, with the national average.
Feedback from teachers who have used the labour market information in lessons said that their students have responded positively to the way information is presented. The regional information was found to be popular amongst teachers, as help students to start to think about their local employment market.
What next for icould and LMI for All?
‘We see this as an important part of enhancing our offer. As long as the LMI for All data continues to be updated, it will remain part of the icould website. The website is maintained and developed using funding from a range of sources, so as long as the website is funded then there will be resourcing in place to continue using LMI for All.‘
icould have recently set up detailed user metrics to show how the site is used and qualitative user testing is also in the pipeline, which will provide further evaluation into the use of LMI data on the site. icould, with its partners, will continue to evaluate how the data are used to inform further refinements. icould plan to continue using the LMI for All data in the long term.
icould are now working on more interpretation with support from the team at IER (University of Warwick). icould are developing a simple guide to interpreting labour market information, including for example what to look for when presented with data, how to understand data and what do the data say.
icould showreel
This showreel gives you some background to icould and the services provided.