
Limitations of LMI
Learning objectives
- To reflect on some limitations of LMI from different sources
- To examine tools for accessing different sources of LMI.
Some limitations of LMI
Different stakeholders in the careers field (for example, practitioners, managers, teachers, researchers, policy makers, funders etc.) will want different LMI for different purposes. For example, for different ages and stages, career practitioners will need different types of LMI for students in schools. In Year 9, LMI related to subject choices is needed, while in Year 13, LMI related to choices of education, training and career pathways are likely to be needed.
Official national and regional statistical agencies are a major source of official LMI in the UK, used for the purpose of informing career decision making. All data are collected for a purpose and the process of collection is usually costly. So, when reviewing different sources of LMI, we do need to be mindful of how they were collected (that is, what methods of data collection were used, like interviews compared with statistical surveys) and why (for example, to inform government policy, to guide resource allocation, or to support individuals in labour market transitions). Methods of data collection and purposes for which data are collected are likely to determine the type and sometimes the quality of data.
Official statistical agencies
Official national and regional statistical agencies are a major source of ‘official’ LMI for careers practice.
The Office of National Statistics (ONS) collects data relating, for example, to: the overall numbers of individuals employed and unemployed in the population; average pay levels in different occupations; and the numbers employed in different occupations. In common with other statistical agencies, ONS are increasingly providing access to data through tools that help users to visualise the data (that is, through graphs and charts).
Data relating to occupations are collected as part of the Labour Force Survey, a subset of which is included in the European Labour Force Survey, compiled by Eurostat. Some of the data, for instance unemployment rates in different European countries, can be accessed through the Eurostat visualisation tools.
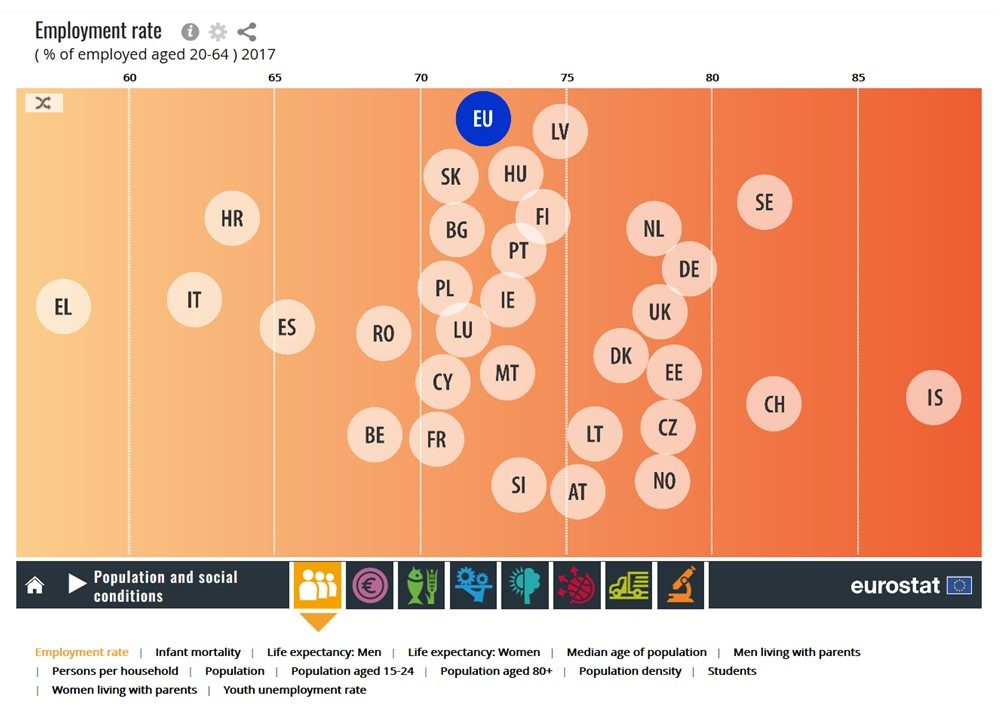
Source: Eurostat
ONS, in common with other statistical agencies, are increasingly providing access to data through tools that help users to visualise the data (that is, through graphs and charts). The nomis web service also offers local labour market profiles, drawn from a range of indicators.

The nomis web service is provided by the ONS to give you free access to the most detailed and up-to-date UK labour market statistics from official sources. The nomis web site also offers local labour market profiles, drawn from a range of indicators. See for example the Labour Market Profile for Coventry.
Limitations: Different data sets can be downloaded in spreadsheet format from the ONS website. One problem is that it is hard to make sense of large spreadsheets. ONS publish summary reports, but these are more geared to economic reporting for policy purposes than the type of LMI at which that we are looking.
Statistical agencies are not the only source of official data.
- Organisations responsible for education and training (for example, universities and other education and training organisations) often publish their own data.
- Local governments may publish other types of data, for instance on travel-to-work times and distances involved.
- Additionally, labour market ministries and agencies within each country are likely to collect data about skills shortages and projections of future employment by occupation.
Open data

There may be problems in accessing these official data because of the structure and form in which they are being published (that is, for particular audiences, like policy makers), with different datasets sometimes linked together. But with the move towards ‘open data’, different agencies and organisations are starting to produce their own data portals, especially on a regional or city level. With fast growing research and development around big data, together with the use of cloud computing, access to graphical interfaces and visualisations is becoming more common.
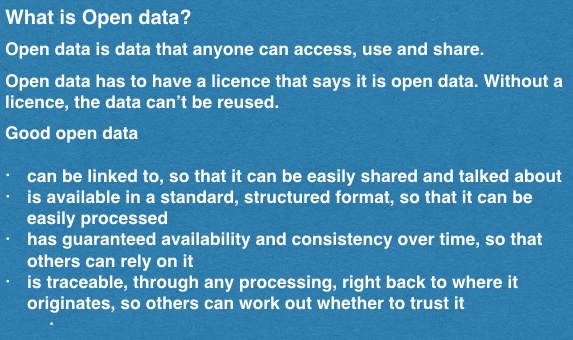
Source: Open Data Institute
National censuses are another rich source of LMI. However, they are usually only undertaken on a periodic basis (in the UK, every 10 years, so 2020 is the year of the next census) and the lead time until the data is published can reduce the value for using in employment or careers practice.
Other organisations, like the European Centre for the Development of Vocational Training (CEDEFOP) collect data on a European level (e.g. skills forecasting).
Tools for accessing sources of LMI
The UK Department for Education has funded the development of ‘LMI for All’, an online data portal, which connects and standardises existing sources of high quality, reliable, up-to-date LMI for the purpose of informing careers decisions. This data is made freely available via an Application Programming Interface (API) for use in websites and applications. The portal makes data available and encourages open use by applications and websites that can bring the data to life for a range of audiences.
Source: LMI for All – UK Department for Education from Creative Grid.
LMI for All is an open data project, which is supporting the wider UK government agenda to encourage use and re-use of government data sets. Tools built on top of LMI for All provide an easy way of accessing and querying a range of different labour market data. One of the tools, developed by the LMI for All team, is a widget called a Careerometer allowing the comparison of different occupations. The Careerometer widget is intended to be very easy for organisations with limited access to skills and resources to embed in their own websites. You can try out Careerometer here.
Case study

Jo is an electronic engineering technician who is unemployed and having difficulty finding a job in her local area. She has already checked out the local job websites and newspapers for any current job vacancies posted for electronic engineering technicians. Although Jo would like to stay in her local area, she is willing to travel to find work.
- What LMI might help Jo?
- What sources might be relevant?
Jo might want LMI to help her:
Find out which employers have hired electronic engineering technicians in the past in her local community. This way Jo can make sure she has exhausted the opportunities in the local area. If she decides that it is time to expand the area for her job search, she might want to put together a list of potential employers in the area that she is willing to re-locate to.
Find out where electronic engineering technicians are in demand, and what the current wage rate for electronic engineering technicians is in the area she is considering relocating to. Think about whether her skills are really up to date – or does she need some top up training? Anything else?
What does all this LMI mean for her?
Of course, armed with all of this LMI, arises the ‘so-what’ factor! Jo will probably want to talk to someone. She may still have questions, and may end up coming to you for help. What topics and issues will you be prepared to discuss, and the other resources you might you use will largely depend on the theoretical framework informing your practice. What will this be? Will the focus be on LMI, or will it be about job search techniques, marketing herself, transferable skills, identifying the hidden jobmarket, decision making?
How would you advise Jo in the case study above? What LMI would you want and where would you look for it?
Further reading and reflection

What sources of LMI do you use. What are their strengths and what are their weaknesses?
Read NESTA’s report on Data for Good: How big and open data can be used for the common good (2015).
Go to the next unit: Features of LMI