
Understanding the Value of Education: Exploring the Return to Education
Sangwoo Lee
University of Warwick Institute for Employment Research (IER)
What is the Return to Education?
Education is widely regarded as a fundamental pillar of personal and societal advancement. The term ‘return to education’ commonly refers to the various benefits or advantages that individuals can accrue through investing in their educational pursuits, whether by attaining higher levels of formal education or acquiring additional skills and knowledge via informal training programmes.1 In economic terms, attaining higher levels of education can be conceptualised as an economic investment wherein individuals incur costs—such as tuition fees and opportunity costs of forgoing employment to pursue studies—with the expectation of yielding higher earnings throughout their working lives. The return to education often signifies the anticipated increase in earnings associated with an individual’s educational achievements. This concept is grounded in the premise that education enhances human capital, thereby increasing individuals’ productivity and value in the labour market. As a result, individuals with higher educational attainments typically command higher earnings than their counterparts with lower levels of education. A large literature predominantly focuses on examining the return to Further Education or Higher Education, given the widespread assumption and empirical evidence indicating that individuals who completed either Further Education or Higher Education typically experience higher earnings compared to those without such qualifications.
Considering the return to education, it is essential to distinguish between private and social returns. The costs incurred and benefits received by society as a whole differ from those experienced by individuals.2 Private costs of education encompass tuition fees or opportunity costs associated with forgoing employment, while social costs of education include the resources used to construct and maintain school facilities, train teachers and the potential output lost when productive workers are in school rather than in workforce. A stream of social benefits may be viewed as increments to social welfare, which is often dependent positively on various factors, including but not limited to the present value of aggregate outputs and the proportion of the labour force employed. It is noteworthy that estimating social returns to education is inherently more complex than estimating private returns due to the lack of consensus on the social welfare function and varying weights assigned to different components by researchers and policymakers. Given these challenges, this unit will primarily focus on reviewing the measurement of private returns to education.

Photo by Tim Mossholder on Unsplash
When estimating the (private) rate of return for investments in education or training, several factors come into play, and the process of estimating the rate of return to education and training requires careful consideration of various social and economic factors. The magnitude of these returns to education has been proved to vary depending upon the prevailing job market conditions, the field of study, the level of qualifications, the prestige of university and individual-specific characteristics.
Determinants of Returns to Education
- Supply and demand of graduates and their skills in the labour market
The returns to education are intricately linked to the dynamics of supply and demand of skilled-workers in the labour market, a relationship heavily influenced by factors, such as higher education expansion and the race between technology and education.3 When the supply of graduates surpasses the demand, as seen during periods of economic recession or extensive higher education expansion, there tends to be a downward pressure on the price of graduates’ labour, or wages, resulting in a decrease in the return to education.4 However, higher education expansion, which leads to an increase in the supply of graduates, does not invariably diminish the return to education. In prosperous economies where the demand for skilled labour is robust, the increased number of graduates stemming from higher education expansion may not necessarily lead to a reduction in the return to education. Instead, a thriving economy can absorb the additional workforce, maintaining or even increasing the value of educational qualifications in the labour market. Moreover, the relationship between technological advancement and education plays a pivotal role in shaping the supply and demand dynamics of graduates. Technological advancement often requires individual workers with specialised skills and knowledge, leading to a higher demand for individuals with relevant educational qualifications, usually higher than a university degree. As such, the level of technological innovation and the pace of change can significantly impact the returns to education. In essence, the intricate interplay between the supply of graduates entering the labour market and the demand for their skills and expertise determines the overall return to education.
- School-related determinants: level of qualifications, university prestige, fields of study and degree class
Recent literature has placed considerable emphasis on school-related determinants that influence the return to education, including the level of qualifications, university prestige, fields of study and degree class. While estimations of the returns to vocational qualifications often exhibit variability across diverse data sources and comparison cohorts, there is a prevailing trend indicating that higher levels of qualifications typically yield greater returns, particularly within the range of Level 3 to Level 5 qualifications, although there are notable exceptions observed below Level 3. Regarding estimates of returns to higher education, the chosen field of study pursued by graduates significantly influences their earning potential, with certain industries and sectors offering higher salaries and better employment prospects for graduates with specific qualifications.5 Disciplines such as Science, Technology, Engineering and Mathematics (STEM), Economics and Medicine often yield higher returns to education compared to other fields.6 Additionally, the classification of a graduate’s degree (e.g., first-class honours, upper second-class honours, lower second-class honours, or third-class honours) can also affect their return to education, including employment prospects and earnings potential. Employers tend to place greater value on candidates with higher degree classifications, perceiving them as more academically accomplished and capable. University selectivity also plays a pivotal role in determining the return to education, operating similarly to degree class distinctions. Attending more prestigious universities may signal to employers that the candidates possess high levels of capability and abilities that may not be readily observable.
- Individual-specific characteristics
Individual-specific characteristics, including gender, ethnicity and age, exert considerable influence on the return to education. Gender and ethnic disparities persist in the UK labour market and globally, shaping individuals’ educational outcomes and subsequent career trajectories. Research often suggests that female and ethnic minorities may face barriers to accessing high-paying jobs or advancing in their careers, despite comparable levels of education. While global and national statistics demonstrate a gradual narrowing of the earnings gap between different groups of gender and ethnicit, these two domains remain pivotal factors determining the return to education. Age also plays a significant role in shaping individuals’ educational and career pathways, thus impacting the returns to education in various ways. Younger graduates may encounter challenges in entering the labour market or advancing in their careers due to their limited human capital, stemming from a lack of work experience. Conversely, older graduates may have accumulated work experience but may encounter age-related discrimination in hiring practices, which may adversely affect their overall return to education.
These determinants interact with each other and with broader economic and social factors to shape the returns to education in the labour market. Understanding these dynamics is essential for policymakers, educators, researchers and individuals seeking to navigate the complexities of the modern workforce and maximise the benefits of individuals’ educational investment.
Measurements of Return to Education
- Earnings (Mincer) Equation
Measurements of the return to education encompass a diverse array of methodologies aimed at quantifying the economic and societal benefits derived from educational investment. One prevalent approach involves comparing the earnings of individuals with varying levels of education while controlling for pertinent factors such as gender, ethnicity, work experience, occupation and geographic location. This methodological approach often utilises the ‘Mincer equation’, which arguably stands as the most widely used framework in empirical research. The Mincer equation estimates employment earnings, i.e., the return to education, as a function of schooling and labour market experience, formulated as follows7,8:
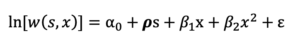
By systematically isolating the influence of education on earnings from other factors, researchers can often gauge the specific impact of educational attainment on individuals’ income levels. This method enables researchers to estimate the monetary value associated with additional years of schooling, different levels of educational qualifications or specialised training programmes. Through robust and meticulous analysis, researchers can understand how each incremental increase in educational attainment contributes to individuals’ earning potential, thereby illustrating the economic returns associated with investing in education.

Photo by Kimberly Farmer on Unsplash
For example, if the value of is 0.035, it implies that each additional year of schooling raises individuals’ earnings, on average, by approximately 3.5%, holding other variables constant. Shifting the focus to comparing the return to attending different types of schooling, the schooling level variable, , denotes the type of secondary schooling, whether independent or state funded. In this case, the return to education, represented by , signifies the extent to which individuals who attended an independent school earn more than those who did not. One study reveals value of 0.308 for females, implying that females who attended an independent school, on average, have approximately 31% higher earnings than their counterparts who attended a state school in the UK, after controlling for other attributes.9
- Net Present Values
The Net Present Values (NPVs) method is also commonly employed to assess the profitability of investments on a particular level of educational qualification over time. Unlike estimating wage premiums as a percentage gap between those possessing a specific qualification and those without, as determined by the Mincer equation provided above, NPVs essentially measure the actual monetary disparity between the present value of individuals’ anticipated earnings following the attainment of a particular level of educational qualification and the present value of their initial investment in the qualification. This involves discounting the future benefits (e.g., increased earnings) and costs (e.g., tuition fees or training expenses) of education or training programmes to their present value with the following equation:
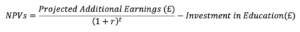
Where r represents the discount rate and t denotes the number of years or periods. The rate used to discount future cash flows reflects the opportunity cost of capital and is typically determined by factors, such as prevailing interest rates, risk premiums, and the expected rate of return on alternative investments. Also, considerations, such as the duration of the investment, the level of risk associated with it and any uncertainties regarding future earnings potential, are often taken into account when specifying the rate of return. A positive NPV indicates that the projected earnings surpass the expected costs, suggesting that the investment in that specific educational qualification is likely to yield profit. For instance, one study reveals that the NPV for a Level 3 Apprenticeship, when individuals commence at ages between 19 and 23, is estimated to £75,000.10
Both the wage premium derived from the Mincer Equation and NPVs have been widely used for estimating the returns to education, predominantly focusing on pecuniary benefits, or earnings. However, in addition to wage differentials and lifetime earnings, measurements of the return to education often extend beyond monetary considerations to encompass broader indicators, such as job quality, employment opportunities and prospects as well as social and non-monetary benefits. Evaluating these multi-faceted dimensions provides a more comprehensive picture of the overall return to education, impacting individuals’ socioeconomic outcomes and societal well-being. By employing a holistic approach to measuring the return to education, researchers can capture the fuller spectrum of benefits associated with educational investment, ranging from enhanced earning capacity to improved social mobility and overall quality of life.
Limitations of Measuring Returns to Education
While the application of the Mincer equation has gained prominence within the fields of economics and education for measuring returns to education, it has encountered challenges primarily related to potential biases it may cause. One notable concern is the presence of what is commonly referred to as a ‘selection (ability) bias’. This bias arises due to the estimation of returns to education based solely on observed or observable personal characteristics, such as years of schooling or types of qualifications. These observed features may not fully capture the underlying abilities or attributes of individuals, namely leadership and motivation, which are typically unobservable to researchers but may significantly influence both educational choices and subsequent labour market outcomes. As a result, differences in unobservable abilities can lead to an overestimation of the rate of return to schooling within the given function unless adequate controls are taken into account to address individuals’ varying attributes effectively.
A similar limitation emerges regarding the definition of comparators when estimating returns to education, particularly for vocational qualifications. Traditional approaches compare the earnings of individuals with a specific qualification (e.g., BTEC at Level 2) to those without any qualifications. This method, however, is problematic as those without formally recognised qualifications are unlikely to possess similar unobservable characteristics as those who have gained a qualification.11 Recent scholarly efforts have focused on refining estimation methods by defining various comparators, leveraging newly available administrative data. These efforts include comparing the earnings of individuals possessing a certain level of qualification with those of individuals holding qualification at lower levels or who started but did not complete courses at the target level. Despite such methodological advancements, challenges persist in fully addressing the underlying reasons for non-entry or non-completion.

Photo by Vasily Koloda on Unsplash
Moreover, additional challenges persist in estimating returns to education, encompassing measurement errors and methodological differences. Microeconomic survey data commonly exhibit measurement errors, particularly in key variables like earnings. While evidence from the existing analyses of the magnitude and impact of measurement errors remains somewhat controversial, they generally tend to underestimate the rate of return to schooling or qualification in classical forms. Moreover, returns to qualifications can be estimated as either average or marginal returns. Average returns encompass all qualifications held by individuals, including those for whom the qualification is their highest achievement and those with higher qualifications. Marginal returns, on the other hand, apply when the qualification obtained is the individual’s highest achieved. Despite advancements in methodologies and datasets enabling more precise and robust estimation of returns to education with various comparators, much of the existing literature often relies on average returns, which may be influenced by the attainment of higher qualifications.
Empirical Evidence: Returns to Education in the UK
Empirical evidence regarding returns to education in the UK highlights the substantial earnings differentials between individuals with specific levels of qualification and those without, as well as between university graduates and non-graduates.12 Generally, individuals with higher levels of educational attainment, on average, command greater earnings in the labour market, spanning both Further Education and Higher Education, with some notable exceptions observed at certain levels within Further Education. Regarding the vocational qualifications, for instance, a body of literature consistently demonstrates negative average returns to Level 1 and 2 National Vocational Qualifications (NVQ), with estimates ranging between -11% to -6% compared to individuals with no formalised qualifications.13 Recent studies confirm positive returns to various vocational qualifications across all specifications, notably exemplified by Advanced Apprenticeship, followed by BTECs, NVQs and Level 4 qualifications, with marginal variations across gender.14
Considering the return to higher education, a substantial body of literature consistently demonstrates that graduates generally experience better outcomes in the labour market compared to non-graduates, although the magnitudes of these advantages tend to diminish when various socioeconomic and university-related factors are taken into account. For instance, a recent study utilising the Longitudinal Education Outcomes (LEO) dataset, focusing on the 2002 GCSE cohort, reveals that by age 29, the average university-educated man earns approximately 25% more than a non-graduate counterpart, while the earnings gap for women widens to over 50%.15 It is however important to acknowledge that this disparity cannot solely be attributed to higher education, as a substantial portion of the difference can be explained by differences in pre-university characteristics. Factors, such as prior education attainment and socioeconomic background, contribute significantly to earning differentials, suggesting that individuals who attend university may inherently possess characteristics associated with higher earnings potential, regardless of educational attainment. Once adjustments are made for disparities in pre-university characteristics—a common method to estimate the return to higher education, empirical analysis reveals that the average impact of attending university on earnings at age 29 stands at 26% for women and 6% for men.
The analyses of return to education have expanded to explore varying effects of the university attended, choice of degree subject and degree classification due to the advancement of statistical methodologies and the availability of various large surveys linked to administrative data. Empirical findings reveal that subjects like Medicine, Economics, Law, Maths and Business often yield substantial earnings premiums over typical graduates, whereas fields like Creative Arts yield earnings roughly equivalent to those of non-graduates.16 Further, considerable variation in earnings is observed across different higher education institutions, largely attributable to student backgrounds plus chosen subjects studied. Empirical research also consistently shows that the return to education is contingent upon family background, with students from higher-income families or advantaged neighbourhoods typically commanding higher earnings, even after controlling for university attended and subject studied (see Figure 1).17 This disparity emphasises the persistence of inequality in educational outcomes and suggests that universities may not provide equal opportunities for individuals from diverse socioeconomic backgrounds. Bottom of Form
Figure 1. Predicted Earnings of Males
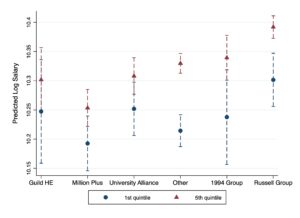
Note: Lee, S. (2022). Figure 1 shows the predicted earnings of males from the most advantaged neighbourhood (with the highest young participation rate in HE, 5th quintile) and the least advantaged neighbourhood (with the lowest young participation rate in HE, 1st quintile) by university mission groups. It implies that graduates who grew up in the highest-participation neighbourhoods, on average, have higher wages than those who came from the lowest-participation neighbourhoods within the same mission group.
Conclusion
The UK has witnessed a substantial transformation in educational attainment since the early 1990s, marked by a significant increase in the proportion of the population holding university degrees, rising from 11% in 1993 to more than triple that figure by 2023. However, despite this expansion in the supply of graduates, the trend in the return to education has remained relatively flat. Various factors contribute to this trend, including the prevailing labour market conditions, factors related to schooling and individuals’ demographic and socioeconomic characteristics. Given the complex interplay of these factors, researchers should carefully consider them when modelling and understanding the returns to education, while also recognising the limitations embedded in such analyses.
References
1 OECD. (2006). The Returns to Education: Education and Earnings. In Education at Glance 2006: OECD Indicators. OECD Publishing.
2 Fields, G. S. (1972). Private and Social Returns. Eastern Africa Economic Review, 4(1), 41–62.
3 Goldin, C., & Katz, L. F. (2008). The Race Between Education and Technology. Harvard University Press.
4 Walker, I., & Zhu, Y. (2008). The College Wage Premium and the Expansion of Higher Education in the UK. The Scandinavian Journal of Economics, 110(4), 695–709.
5 Chevalier, A. (2011). Subject choice and earnings of UK graduates. Economics of Education Review 30, 1187–1201.
6 Bratti, M., & Mancini, L. (2003). Differences in Early Occupational Earnings of UK Male Graduates by Degree Subject: Evidence from the 1980-1993 USR (Discuss Paper Series IZA DP No. 890). Institute for the Study of Labor.
7 Mincer, J. (1974). Schooling, Experience and Earnings. New York: National Bureau of Economics Research.
8 Heckman, J., Lochner, L., & Todd, P. (2003). Fifty Years of Mincer Earnings Regressions, IZA Discussion Papers, No.775, Institute for the Study of Labor (IZA), Bonn.
9 Britton, J., Dearden, L., & Waltmann, B. (2021). The Returns to Undergraduate Degrees by Socio-economic Group and Ethnicity. Institute for Fiscal Studies.
10 Department for Education (2021). Measuring the Net Present Value of Further Education in England 2018/19.
11 Hedges, S., Patrignani, P., & Conlon, G. (2018). Settling the counterfactual debate: Is there a preferable counterfactual when estimating the returns to vocational qualifications? Centre for Vocational Educational Research (Research Discussion Paper 013).
12 Blundell, R., Dearden, L., & Sianesi, B. (2005). Evaluating the Effect of Education on Earnings: Models, Methods and Results from the National Child Development Survey. Journal of the Royal Statistical Society. Series A (Statistics in Society), 168(3), 473–512.
13 Dearden, L., McIntosh, S., Myck, M. and Vignoles, A. (2000) The Returns to Academic and Vocational Qualifications in Britain, CEE Discussion Paper.
Greenwood, C., Jenkins, A. and Vignoles, A. (2007) The Returns to Qualifications in England: Updating the Evidence Base on Level 2 and Level 3 Vocational Qualifications, CEE Discussion Paper 89.
14 Hedges, S., Patrignani, P., & Conlon, G. (2018). Settling the counterfactual debate: Is there a preferable counterfactual when estimating the returns to vocational qualifications? Centre for Vocational Educational Research (Research Discussion Paper 013).
15 Belfield, C., Britton, J., Buscha, F., Dearden, L., Dickson, M., van der Erve, L., Sibieta, L., Vignoles, A., Walker, I., & Zhu, Y. (2018). The impact of undergraduate degrees on early-career earnings. Department for Education.
16 Britton, J., Dearden, L., Shephard, N., & Vignoles, A. (2016). How English Domiciled Graduate Earnings Vary with Gender, Institution Attended, Subject and Socio-Economic Background (IFS Working Paper W16/06). Institute for Fiscal Studies.
17 Lee, S. (2022). Does University Level the Playing Field? Impacts of Spatial Inequalities on the Gap in the Earnings of Similar Graduates: Evidence from the UK. Higher Education Policy.